Summary: What follows is a web adaptation of the introductory chapter of my PhD thesis at Cornell, “Computational perspectives on large-scale social networks” (thesis PDF here). I used the exercise of writing this introduction as an opportunity to write a brief history of the role computation has played in the study of social networks small and large. With the substantive chapters of my thesis all already published in journals/conference proceedings, I am posting the introduction here in full, with the goal of distributing it further than the catacombs of the Cornell University Library.
—
Alas! Forgetful of a husband’s home duties I again became involved in the dissipated social network, whose fatal meshes too surely entangled me, and unfitted me for that active exertion which was now rendered doubly necessary. – John Bartholomew Gough, Autobiography, (1846)
The quantitative study of the structure of social systems dates back to at least the 1930’s, when the social scientist Jacob Moreno introduced the sociogram, a graphical representation of ties between individuals to illustrate the structure of social groups, more modernly referred to as a social network [1] . While the notion that relationships in society form something akin to a “network” is a metaphor that significantly predates Moreno — see the epigraph above — his initial work on sociograms in his 1934 book Who Shall Survive? introduced much more than just a metaphor or visual tool, and in fact developed precursors to many of the modern tools used for analyzing social networks today. Of note, when it was announced at the 127th Annual Meeting of the Medical Society of the State of New York, it received coverage in nothing less than the New York Times.

Headline in the New York Times announcing Moreno’s work. April 3, 1933 (Page L17).
Moreno’s work was inspired by investigations he conducted as Director of Research at the New York Training School for Girls reformatory school in Hudson, NY, where he sought to broadly study determinants of human behavior. Moreno wondered if there were structural explanations for why certain young girls were running away from the school, and thought that sociographic analysis might hold an answer. He was a careful thinker, and beyond merely analyzing the networks he observed, he was quick to seek notions of statistical significance in his analyses. As part of his earliest work, he introduced what he called chance sociograms and what we would now call random graphs, used in permutation tests to see if the structures he was observing were statistically significant. Analyses performed against such randomized baselines are now the cornerstone of many modern measures on social networks, such as network modularity [2], and many of the computational tools for analyzing modern large-scale social networks rely on appropriate constructed random graphs, e.g. random graphs with arbitrary degree distributions [3].

A “chance sociogram” figure from the 2nd Edition of Who Shall Survive?, available here.
Concurrent with Moreno’s development of sociometry and the 1934 publication of Who Shall Survive?, in 1936 the Hungarian mathematician Dénes Kőnig published the first organized textbook on the emerging mathematical field of graph theory, Theorie der endlichen und unendlichen Graphen. The study of graphs is generally considered to have begun in 1736 with Leonhard Euler’s analysis of the “Seven Bridges of Königsberg problem” [4] [5], and has a rich history that predates Kőnig’s textbook (see the riveting book Graph Theory 1736-1936 [6], which covers this era) but it was Kőnig’s textbook that first organized the discipline. It is fortuitous that this should happen concurrently with Moreno’s initial investigations.
As the study of sociograms and sociometry began to take off in the 1950’s, mathematicians such as Anatol Rapoport and Frank Harary successfully led efforts to apply the mathematical language of graph theory to social networks [7] [8] [9] [10]. At the end of the 1950’s, the rigorous study of random graphs initiated by Paul Erdős and Alfred Rényi [11] laid further foundations for studying social networks as mathematical objects. By studying probability distributions over the space of graphs, random graphs made it possible to view Moreno’s work on “chance sociograms” in a rigorous light.
Since these early syntheses, the study of social networks has benefited from a symbiotic relationship with graph theory, which has contributed important operational tools for analyzing social theories. A notable early example of such operationalization — providing precise definitions and measures that enable quantitative analysis — was the work by James Davis and Samuel Leinhardt published in 1967. In that work, Davis and Leinhardt set out to operationalize a theory of small social groups put forward in 1950 by George Homans, contained in his book The Human Group [12]. Homans’ theory proposed that small groups of people inevitably generate a social structure that contains many clique subgroups and a ranking system. Through their work, Davis and Leinhardt provided an “operational statement of Homans’ theory”, that “seven key triads are less frequent than the random model would predict” [13], the infrequent triads being those triads that a graph would be free from if it consisted only of clique subgraphs and directed relationships aligned with an hierarchy.

Figure 1 from Davis & Leinhardt’s 1967 paper, illustrating Homans’ theory of directed relationships. Making figures in the 60’s was hard.
Davis and Leinhardt’s work was importantly exceptional in that it employed an “electronic computer” to perform the involved analysis — in 1967(!) — of adjacency matrices representing 427 groups, and 60 simulated groups with random relationships. While the mathematics of random graphs provided a language for describing Homans’ theory, it was the computational perspective gained through data analysis that was the true essence of their landmark operationalization. Recently, Homans’ social theory of cliques and ranking was re-examined within the context of the National Longitudinal Study of Adolescent Health [14], examining over 90,000 students across 84 school networks in a manner similar to Davis and Leinhardt. This recent work corroborated the findings of Davis and Leinhardt, while also introducing a maximum likelihood inference framework for inferring rankings within the theory [15], a computationally intensive line of inquiry far beyond what Davis and Leinhardt could have hoped to achieve in 1967.
The early computational analyses of Davis and Leinhardt recognized that social networks are complicated mathematical objects, and any manual analysis was intractable even for moderately sized networks. In the decades the followed, the field of social network analysis developed a rich set of computational tools to analyze various social theories computationally [16], but for the most part these analyses did not attract much attention from mathematicians or computer scientists.
As the 20th century drew to close, however, a broad range of other research communities turned their attention to diverse research problems centered around large-scale graphs. In the narrow window between 1997 and 2000, significant advances were made by mathematicians studying the theory of random graphs and percolation theory [17] [18], applied mathematicians studying synchronization of oscillators [19], statistical physicists studying scaling laws [20] [21] [22] [23], and computer scientists from subfields including artificial intelligence, information retrieval, and data mining all studying various combinations of web mining [24] [25], link analysis [26] [27], graph partitioning [28], and communication network architectures [29].
Some of these early analyses did in fact extend to social networks, notably the Watts-Strogatz model of “small-world networks” that introduced a class of sparse graphs concurrently exhibiting both a small diameter and clustering (many triangles). Before small-world networks were introduced, it was known that sparse Erdős-Rényi random graphs exhibited a small diameter with high probability and that lattice graphs exhibited clustering, while empirically it was known that social networks exhibited both these properties, but there was no good model of sparse graphs exhibiting the two traits concurrently. By introducing the clustering coefficient of a graph as a definition of clustering, and by showing that small-world networks exhibit a high clustering coefficient and a small diameter, Watts and Strogatz contributed an important operationalization of how social network models can be deemed realistic.
In addition to analyzing their theoretical model of small-world networks, Watts and Strogatz analyzed three datasets: a network of film actors collaborations, the electrical power grid of the western United States, and the neuronal network of the nematode worm C. elegans. The network of film actors was quite large, documenting collaborations between more than 225,000 actors using data available from the Internet Movie Database (IMDB) as of April 1997. While the traditional social network analysis community had been studying small-scale network datasets for decades, the work by Watts and Strogatz coincided with the availability of large-scale datasets being organized on the world wide web, including the link structure of the web itself [22] [23] and the network structure of the internet itself [18] [29]. While the early web was principally organized around documents and information, it soon became clear that large portions of the internet were in fact encoding human relationships and other human behavior. In the presence of data, the scale of social networks being analyzed was perched to grow by orders of magnitude.
Research efforts gradually began targeting increasingly ambitious scales of social network structure, a progression that in turn required increasing computational sophistication. Some efforts focussed on the social network of academic collaborators, studying first smaller networks of researchers affiliated with a single institution [30], and in 2003 Liben-Nowell and Kleinberg used a dataset of 23,500 authors and 100,000 co-authorships to frame the problem of link prediction in social networks [31]. Another source of social relations that quickly landed under the microscope was e-mail: in 2004 a corpus of over 600,000 emails between 158 employees of the Enron Corporation was released to the public through the Federal Energy Regulatory Commission, and subsequently became an object of frequent study [32] [33], while another major study by Kossinets and Watts examined the email exchanges of 43,000 students, faculty, and staff at a large university [34]. As more and more individuals set up personal homepages on the web, in 2003 it occured to Adamic and Adar to study the links between 9,700 homepages at Stanford and at MIT as social networks [35]. The link structure of personal weblogs was next, and it was here that scales first became truly overwhelming. In 2005, Adamic and Glance studied 1,494 political blogs in the wake of the 2004 election [36], while later the same year the analysis of 1.03 million weblogs indexed through blogdex was released [37], and two separate studies of over 1 million blogs hosted at LiveJournal were used to perform detailed analyses of geographic assortativity [38] and of the social process of group formation [39]. To both gather and analyze graph data of these scales, computational naiveté was no longer admissible.

A pretty picture: polarized political blogs visualized by Adamic & Glance in 2006.
In a few short years, computational perspectives had made it possible to study social networks at tremendous scales. In many ways the 21st century’s first decade offered a golden age of large-scale observational data analysis: because no one had ever assembled datasets of these magnitudes before, simply answering basic questions in an observational setting provided a coarse answer where no previous attempt at an answer had been possible. In 2006, basic questions of collective action and group dynamics studied in the 1970’s by Granovetter [40] and Schelling [41] were given computational reformulations and analyzed at scale in the context of LiveJournal group formation by Backstrom and colleagues [39]. In 2008, Stanley Milgram’s creative investigations of the 1960’s into the six degrees of separation phenomenon by initiating 160 chain letters [42] was reexamined at a planetary scale through the MSN online chat network [43] (and more recently on Facebook [44]). As the study of large-scale social networks progressed to encompass not just small groups or samples but various notions of “all the data,” for a while it nearly seemed as though any social theory could be tested by studying large enough observational social network datasets.
Unfortunately, there are limits to what an observational data analysis can discern, no matter how large the dataset. While more and more data makes it possible to provide increasingly accurate predictive understandings of nearly any question related to that data, social theories often concern themselves with causal relationships, not just predictive relationships. Most particularly, theories of social influence are specifically theories about causal relationships. In line with these concerns, the more recent era of analyses examining large-scale social networks has been attempting to target causal understandings, when possible.
In 2007, Christakis and Fowler released a large-scale analysis of social contagion within the 12,000 study participants in the longitudinal Framingham Heart Study, claiming that obesity was socially contagious [45]. Christakis and Fowler were interested in the role of social influence in public health, and realized that the Framingham study, which had been running for over thirty years, had been surreptitiously collecting social relationship information as part of its periodic surveys over these thirty years, providing a convenient opportunity to test various theories of how individuals influence each others’ health through social relationships. The difficulty with understanding social influence in social settings is that, even if they could have gone back in time to design the study to include a randomized trial, or even if they were able to wait 30 years for a new study to be conducted, it is not possible to reliably randomize individuals’ social ties. Recognizing that a randomized trial would be difficult, they hoped that by applying a thoughtful methodology they could tease out a causal understanding of how the health of individuals influence each other through time. Unfortunately, a careful analysis by Shalizi and Thomas in 2011 showed that, as the title of that work clearly communicated, “homophily and contagion are generically confounded in observational social network studies” [46]. Shalizi and Thomas showed that it was not possible to distinguish homophily — the notion that like attracts like and that similar people are more likely to be friends — from social influence. Christakis and Fowler had established that being friends with an obese person predicted that you would become obese, but attempts to establish causality inherently ran up against the obstacles discovered by Shalizi and Thomas.
The research conversations surrounding the Christakis and Fowler study, including the Shalizi and Thomas negative result, rightly gave the large-scale social networks research community pause for thought. The conversation initiated a rapid shift towards more careful experimental approaches that married large-scale analysis with causal inference. As another analogy, in 2007 Centola and Macy had initiated a successful research program studying complex contagion, the notion in collective action that individuals do not respond to social cues independently or linearly, but they perhaps respond superlinearly as a function of the number of peers providing cues. Through simulation analyses [47] [48], they had shown that complex contagion behaved very differently than simple contagion on various network topologies. In 2010 and 2011, Centola published two randomized experiments to establish that human subjects did in fact make decisions consistent with complex contagion [49] [50]. Other important work, including by Aral and colleagues [51], introduced the social networks community to propensity score matching, an established methodology developed in the 1980’s by the statistical inference community [52] for reducing bias in observational studies.

Adopters of the Yahoo! Go application, and those who could be explained by homophily using propensity score matching. From Figure 4 of Aral et al. 2009.
In recent years, the widespread application of randomized experiments to large-scale social networks studies has been tremendously successful. A large-scale hold-out experiment conducted in 2010 on Facebook was able to quantify the significant role of homophily in information diffusion [53], the general confounder that Shalizi and Thomas had identified in observational studies of influence. The important role of social factors in voter turn-out was similarly examined at scale through Facebook in a 61-million participant experiment led by Fowler and colleagues [54], this time employing a randomized experiment. Throughout these advances, computational perspectives have been at the heart of operationalizing diverse theories of social and human behavior, and as studies target increasingly sophisticated hypotheses, including those pertaining to causal relationships, the demand for computational machinery only increases.
It is important to emphasize that the negative result of Shalizi and Thomas, that homophily and social influence are generally confounded, is specifically a critique of studies of social influence. It is certainly not a blanket dismissal of non-causal investigations of social networks. First, there are many social theories that are not causal, such as basic structural claims of connectivity, clustering, and assortativity. Second, there are many questions where causal experiments are not possible, such as randomizing who people are friends with. The questions posed by Christakis and Fowler are certainly of grave consequence for public health, and the best possible answers, with properly documented caveats, are undeniably of great interest.
Beyond providing a quantitative language for existing social theories, computational perspectives also contribute their own findings. The investigations of network ranking and centrality that helped transform search engines such as Google into the backbones of the modern web [27b] have also had exciting implications for understanding social networks. When tracking infectious diseases, it has been postulated [55] and later shown [56] that rather than tracking random individuals, there are significant advantages to tracking friends of random individuals, a strategy that explicitly seeks out nodes of a social network with higher centrality. The use of such “friend sensing” has been shown empirically to track a flu epidemic on a college campus with a two week lead time compared to tracking random individuals [56]. In another vein, link prediction algorithms [31b] have been tremendously useful to online social networking services such as Facebook and LinkedIn. In the context of link prediction, the fundamental question is precisely predictability, and not causality, and Facebook has employed various observational findings regarding assortative mixing in geographic [38b] and other latent spaces to make friend recommendations through their “People You May Know” service. These recommendations ultimately drives 40 percent of all friendships formed on Facebook. Overall, the study of social networks has come to increasingly rely on computational perspectives, and it has been the goal of this thesis to push the means of analysis forward for a new generation of both insights and applications. The contributions in this thesis are variously distributed, and were developed to enrich several of the points in the above overview of the field.
Papers in my thesis
For those who are interested, below are the substantive chapters of my thesis, all published and freely available in their published form. The first two papers use computational perspectives to gain insight about social decisions and social network structure.
- J Ugander, L Backstrom, C Marlow, J Kleinberg. Structural Diversity in Social Contagion, Proc. of the Nat’l Academy of Sciences (PNAS), 109(16) 5962-5966, 17 April 2012.
- J Ugander, L Backstrom, J Kleinberg. Subgraph Frequencies: Mapping the Empirical and Extremal Geography of Large Graph Collections, Proc. 22nd Int’l World Wide Web Conf. (WWW), 2013.
The next two papers discuss graph partitioning frameworks for massive social networks. The first of these was successfully deployed at Facebook to partition data for their “People You May Know” servers.
- J Ugander, L Backstrom. Balanced Label Propagation for Partitioning Massive Graphs, Proc. 6th ACM Int’l Conf. on Web Search and Data Mining (WSDM), 2013.
- J Nishimura, J Ugander. Restreaming Graph Partitioning: Simple Versatile Algorithms for Advanced Balancing, Proc. 19th ACM SIGKDD Int’l Conf. on Knowledge Discovery and Data Mining (KDD), 2013.
Finally, the last paper in my thesis is on the subject of network experimentation, and describes a framework for designing and analyzing controlled experiments in networked settings rife with interference:
- J Ugander, B Karrer, L Backstrom, J Kleinberg. Graph Cluster Randomization: Network Exposure to Multiple Universes, Proc. 19th ACM SIGKDD Int’l Conf. on Knowledge Discovery and Data Mining (KDD), 2013.
The full thesis PDF, for those interested is available here.
References
[1] J.L. Moreno. Who Shall Survive? Foundations of sociometry, group psychotherapy and socio-drama, Nervous and Mental Disease Pub. Co., 1934.
[2] M.E.J. Newman, M. Girvan. Finding and evaluating community structure in networks. Physical Review E}, 69:026113, 2004.
[3] M.E.J. Newman, S.H. Strogatz, D.J. Watts. Random graphs with arbitrary degree distributions and their applications. Physical Review E 64.2, 026118, 2001.
[4] L. Euler, Solutio problematis ad geometriam situs pertinentis, Commentarii Academiae Scientiarum Imperialis Petropolitanae 8, p. 128-140, 1736.
[5] B. Hopkins, R.J. Wilson. The Truth about Königsberg. The College Mathematics Journal 35.3, p. 198-207, 2004.
[6] N.E. Biggs, K. Lloyd, R.J. Wilson. Graph Theory 1736-1936. Oxford University Press, 1976.
[7] A. Rapoport. Spread of information through a population with socio-structural bias I: Assumption of transitivity. Bulletin of Mathematical Biophysics, 15(4):523–533, December 1953.
[8] F. Harary, R.Z. Norman. Graph theory as a mathematical model in social science. University of Michigan Research Center for Group Dynamics, 1953.
[9] D. Cartwright, F. Harary. Structural balance: a generalization of Heider’s theory. Psychological review 63.5, p. 277, 1956.
[10] D. Cartwright, F. Harary, R.Z. Norman. Structural models: An introduction to the theory of directed graphs. Wiley and Sons, New York, 1965.
[11] P. Erdos, A. Renyi. On random graphs. Publicationes Mathematicae Debrecen 6, p. 290-297, 1959.
[12] G.C. Homans. The Human Group. Harcourt, Brace and World, New York, 1950.
[13] J. Davis, S. Leinhardt. The structure of positive interpersonal relations in small groups. In Sociological Theories in Progress. Vol. 2, eds. J. Berger, M. Zelditch, and B. Anderson. Houghton-Mifflin, 1971.
[14] M.D. Resnick, et al. Protecting adolescents from harm: findings from the National Longitudinal Study on Adolescent Health. JAMA 278.10, p. 823-832, 1997.
[15] B. Ball, M.E.J. Newman. Friendship networks and social status. Network Science 1.01, p. 16-30, 2013.
[16] S. Wasserman, K. Faust. Social Network Analysis: Methods and Applications. Cambridge Univ. Press, 1994.
[17] M. Molloy, B. Reed. The Size of the Largest Component of a Random Graph on a Fixed Degree Sequence. Combinatorics, Probability and Computing 7 , 295-306, 1998.
[18] W. Aiello, F. Chung, L. Lu. A random graph model for massive graphs. In STOC. ACM, 2000.
[19] D.J. Watts and S.H. Strogatz. Collective dynamics of `small-world’ networks. Nature, 393(6684):440-442, 1998.
[20] H.E. Stanley. Scaling, universality, and renormalization: Three pillars of modern critical phenomena. Reviews of modern physics, 71.2, 1999.
[21] A.L. Barabási, R. Albert. Emergence of scaling in random networks. Science 286.5439, p. 509-512, 1999.
[22] R. Albert, H. Jeong, A.L. Barabasi. Internet: Diameter of the world-wide web. Nature 401.6749, p. 130-131, 1999.
[23] B.A. Huberman, L.A. Adamic. Internet: growth dynamics of the world-wide web. Nature 401.6749, p. 131-131, 1999.
[24] R. Cooley, B. Mobasher, J. Srivastava. Web mining: Information and pattern discovery on the world wide web. In Proceedings 9th IEEE Conference on Tools with Artificial Intelligence, 1997.
[25] D. Gibson, J. Kleinberg, P. Raghavan. Inferring web communities from link topology. In Proceedings of the ninth ACM conference on Hypertext and hypermedia, ACM, 1998.
[26] J. Kleinberg. Authoritative sources in a hyperlinked environment.
Proc. 9th ACM-SIAM Symposium on Discrete Algorithms, 1998. Also appears as IBM Research Report RJ 10076, May 1997.
[27] [27b] L. Page, S. Brin, R. Motwani, T. Winograd. The PageRank citation ranking: Bringing order to the web. Stanford Digital Library Technologies Project TR, Jan. 1998. (Early version: L. Page. PageRank: Bringing order to the web. Stanford Digital Libraries Working Paper 1997-0072, Stanford University, 1997.)
[28] G. Karypis and V. Kumar. A fast and high quality multilevel scheme for partitioning irregular graphs. SIAM J Sci Computing, 20(1):359–392, 1998.
[29] M. Faloutsos, P. Faloutsos, C. Faloutsos. On power-law relationships of the internet topology. ACM SIGCOMM Computer Communication Review. Vol. 29. No. 4. ACM, 1999.
[30] M. Girvan, M.E.J. Newman. Community structure in social and biological networks. Proceedings of the National Academy of Sciences 99.12, p. 7821-7826, 2002.
[31] [31b] D. Liben-Nowell, J. Kleinberg.
The Link Prediction Problem for Social Networks. In CIKM, 2003.
[32] B. Klimt, Y. Yang. The Enron Corpus: A new dataset for email classification research. Machine learning: ECML 2004. Springer Berlin Heidelberg, p. 217-226, 2004.
[33] A. McCallum, A. Corrada-Emmanuel, X. Wang. Topic and role discovery in social networks. In IJCAI, 2005.
[34] G. Kossinets, D. Watts. Empirical analysis of an evolving social network. Science 311:88, 2006
[35] L.A. Adamic, E. Adar. Friends and neighbors on the web. Social networks 25.3: 211-230, 2003.
[36] L.A. Adamic, N. Glance. The political blogosphere and the 2004 US election: divided they blog. In Proceedings of the 3rd international workshop on Link discovery, ACM, 2005.
[37] C. Marlow. The structural determinants of media contagion. PhD Thesis, Massachusetts Institute of Technology, 2005.
[38] [38b] D. Liben-Nowell, J. Novak, R. Kumar, P. Raghavan, A. Tomkins. Geographic routing in social networks. PNAS, 102:11623, 2005.
[39] L. Backstrom, D. Huttenlocher, J. Kleinberg, X. Lan. Group formation in large social networks: membership, growth, and evolution. Proc 12th ACM SIGKDD Intl Conf on Knowledge Discovery and Data Mining, pp 44-54, 2006.
[40] M. Granovetter. Threshold models of collective action. Am J Sociol 83:1420, 1978.
[41] T. Schelling. Dynamic models of segregation. {\it J Math Sociol} 1:143, 1971.
[42] S. Milgram. The small world problem. Psychology today 2.1 p. 60-67, 1967.
[43] J. Leskovec, E. Horvitz. Planetary-scale views on a large instant-messaging network. In WWW, 2008.
[44] L. Backstrom, P. Boldi, M. Rosa, J. Ugander, and S. Vigna. Four Degrees of Separation. In WebSci, 2012.
[45] N.A.~Christakis, J.H.~Fowler. The spread of obesity in a large social network over 32 years. New Engl J Med, 357:370, 2007.
[46] C.R. Shalizi, A.C. Thomas. Homophily and contagion are generically confounded in observational social network studies. Sociological Methods & Research, p. 211-239, 2011.
[47] D. Centola, V. Eguiluz, M. Macy. Cascade dynamics of complex propagation. Physica A, 374:449, 2007.
[48] D. Centola, M. Macy. Complex contagions and the weakness of long ties. Am J Sociol, 113:702, 2007.
[49] D. Centola. The spread of behavior in an online social network experiment. Science 329.5996, p. 1194-1197, 2010.
[50] D. Centola. An experimental study of homophily in the adoption of health behavior. Science 334.6060, p. 1269-1272, 2011.
[51] S. Aral, L. Muchnik, A. Sundarajan. Distinguishing influence-based contagion from homophily-driven diffusion in dynamic networks. Proc Nat Acad Sci USA, 106:21544, 2009.
[52] P.R. Rosenbaum, D.B. Rubin. The central role of the propensity score in observational studies for causal effects. Biometrika 70.1 p. 41-55, 1983.
[53] E. Bakshy, I. Rosenn, C. Marlow, L. Adamic. The role of social networks in information diffusion. In WWW, pp. 519-528. ACM, 2012.
[54] R.M. Bond, C.J. Fariss, J.J. Jones, A.D.I. Kramer, C. Marlow, J.E. Settle, J.H. Fowler. A 61-million-person experiment in social influence and political mobilization. Nature, 489, no. 7415, p. 295-298, 2012.
[55] R. Cohen, S. Havlin, D. Ben-Avraham. Efficient immunization strategies for computer networks and populations. Physical Review Letters 91, no. 24, p. 247901, 2003.
[56] N.A. Christakis, J.H. Fowler. Social network sensors for early detection of contagious outbreaks. PLOS one 5, no. 9, e12948, 2010.
 . Clearing up some things about the Moon-Moser theorem, a non-sharp lower bound on the density of cliques in a graph of edge density
 ![{p \in [0,1]}](https://s0.wp.com/latex.php?latex=%7Bp+%5Cin+%5B0%2C1%5D%7D&bg=ffffff&fg=000000&s=0&c=20201002) , the asymptotically minimal density of triangles is given by:
, the asymptotically minimal density of triangles is given by: 
 . Here
  is the homomorphism density of the the triangle
  in
in  . For cliques, the homomorphism density can be understood as exactly equal to the subgraph density — the proportion of subgraphs of a graph that are isomorphic to the clique. For subgraphs other than the clique the relationship is more complicated (see Section 4.1 of our subgraph frequencies paper), but the difference is not relevant here.
  -node cliques, not just the triangle (the 3-node clique). The Moon-Moser bound says that for a fixed edge density
 ![{p \in [(r-2)/(r-1),1]}](https://s0.wp.com/latex.php?latex=%7Bp+%5Cin+%5B%28r-2%29%2F%28r-1%29%2C1%5D%7D&bg=ffffff&fg=000000&s=0&c=20201002) , the asymptotically minimal density of triangles is given by:
, the asymptotically minimal density of triangles is given by: 
 this bound is simply
  for
for  . For triangles, this bound is therefore eons simpler than the Razborov bound above. How close are these two functions? See here:
 and the number of cliques of size
  nodes has
  edges
edges  , then it contains at least
  complete k-graphs.” That formula is unclear (how would
  proceed?) and also omits the proper restriction on edge density
  . Lovász is no doubt aware of these restrictions, but mere mortals trying to dive in to the literature on dense graphs may stumble as I did. My hope in documenting this derivation is that someone doing research involving the Moon-Moser bound might find it useful.
 denote the number of complete subgraphs of
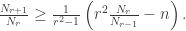
 , where
  is the homomorphism density of
  in
in 
 given earlier:
  -free Turán graph has asymptotic (in
  . As a result, we know that the lower bound on the density of
  is zero for
  : there doesn’t have to be any
  . This means that for
  , the polynomial function must cross above zero and be strictly positive for some values of
  , a fact that is clearly contradicted by the
  , and notice that
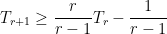
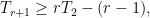
 . Thus:
 , and the recurrence can be written as:
 is sharp for
  , we can fortunately restrict our analysis of the recurrence to
  , at which point the variables of the recurrence are all non-negative, and we obtain the closed polynomial lower bound as stated in the theorem.